Our Changing Watershed: The evolution of the Muskoka Watershed Report Card
Reporting on the overall health of our watersheds.
By Rebecca Willison.
Muskoka Watershed Council (MWC) is set to release its sixth Muskoka Watershed Report Card this summer, the result of 20 years of evolution and change. How did we get here?
In 2001, when MWC was formed, founder Ken Black identified the “development of a model to assess the current heath of Muskoka’s watersheds and provide benchmarks for future assessments” as a top priority for the council. He recognized that the model should be scientifically based but easily understood by the watershed community. Without measuring and reporting on the health of our environment over time, small changes in condition may go unnoticed until irreversible damage occurs, thus the Muskoka Watershed Report Card was born.
The report card uses a suite of indicators to report on the overall health of our watersheds. Much thought goes into the development of indicators for each report card. Selecting indicators is not an easy task, as each indicator must be relevant, easy to understand, reliable, measurable and include data from across MWC’s area of interest. The first report card, released in 2004, focused on swimability, drinkability, fishability, and breathability.
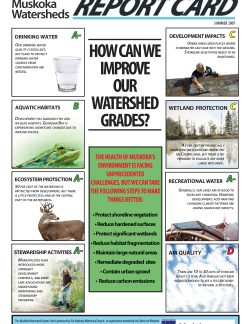
The indicators used in subsequent report cards, released in 2007, 2010, 2014, and 2018, evolved depending on the data available and new issues identified, and were categorized into land, water, wetlands and wildlife. Some indicators, like phosphorus concentrations in water, have been included in every report card, while others, like air quality, were discontinued for various reasons. The result is that recent report cards have been more consistent with the indicators used and how they are reported, allowing for trends over time to be identified.
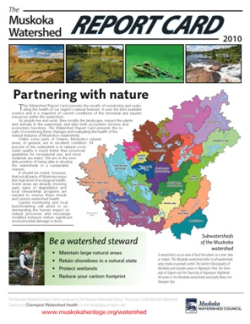
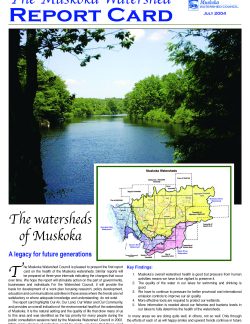
The biggest differences between our first report card in 2004 and our last report card in 2018 is related to technology, primarily with advances in mapping applications and geographic information system (GIS) data. The 2004 report card reported on indicators at a tertiary watershed scale (i.e. Muskoka River Watershed, Black River Watershed) and included a hand-coloured watershed map! By 2010, technology had advanced enough for us to report on indicators at a quaternary watershed scale (i.e. Lake of Bays Subwatershed, Gibson River Subwatershed), allowing for a more nuanced look at the health of different parts of our watersheds.
Technology has also allowed us to improve the report card itself and how it is presented to the community. An interactive PDF format of the report card was introduced in 2010, and in 2018 the report card used a series of online Story Maps to present the data using maps, videos, and photos, allowing the public to drill down in the data to a lake level for some indicators. Finding new ways to engage the community and present the results of the report card is an ongoing challenge for MWC and one that we embrace as we strive to bring awareness to issues like climate change.
So what is next for the Muskoka Watershed Report Card? The 2023 report card will be released this summer and includes some new indicators, like chloride concentration in water and ecological integrity, as well as many indicators used in previous report cards, like calcium concentration in water and habitat fragmentation. The 2023 report card will also include an analysis of trends over time for some indicators, which will provide an idea of how we are doing at protecting our watersheds. Most notably, the report card will include climate change as a unifying theme — a common stressor influencing many other indicators. Check out the next article in the Our Changing Watershed series for some highlights of the upcoming Muskoka Watershed Report Card.
Introduction
Chapter 1 – Calcium Concentrations in Muskoka’s Lakes
Chapter 2 – Phosphorus Concentrations in Lakes
Chapter 3 – Benthic Macroinvertebrates in Muskoka
Chapter 4 – Chloride
Chapter 5 – Fish Populations in our Lakes
Chapter 6 – Hazardous Algal Blooms

Chapter 7 – Interior Forests
Chapter 8 – Fragmentation
Chapter 9 – How are Muskoka’s Avian Species Changing?

Chapter 10 – Invasive Species
Chapter 11 – Beech Bark Disease
Chapter 12 – Species at Risk in Muskoka

Chapter 13 – Weather and Climate
Chapter 14 – Ecosystem Integrity and Measuring Watershed Health
References and Acknowledgements
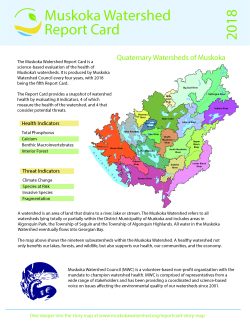
2018 Muskoka Watershed Report Card
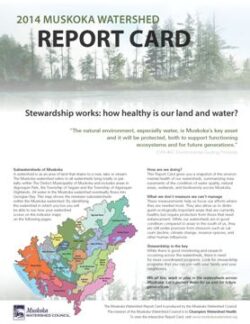
2014 Muskoka Watershed Report Card
2010 Muskoka Watershed Report Card
2007 Muskoka Watershed Report Card
2004 Muskoka Watershed Report Card

This article is one of Muskoka Watershed Council’s summer 2023 series on “Our Changing Watershed” in The Muskokan newspaper. This week’s article was contributed by Rebecca Willison, a watershed planning technician with the Muskoka Watershed Council and District of Muskoka. The series editor is Neil Hutchinson, a retired aquatic scientist, Bracebridge resident and director, Muskoka Watershed Council.