Monthly Archives: July 2018
How much Interior Forest is enough?

The 2018 Muskoka Watershed Report Card produced by the Muskoka Watershed Council features 8 different indicators of watershed health. Interior Forest is one of these indicators, categorized as a health indicator rather than a threat indicator as it contributes to the health of our watershed.
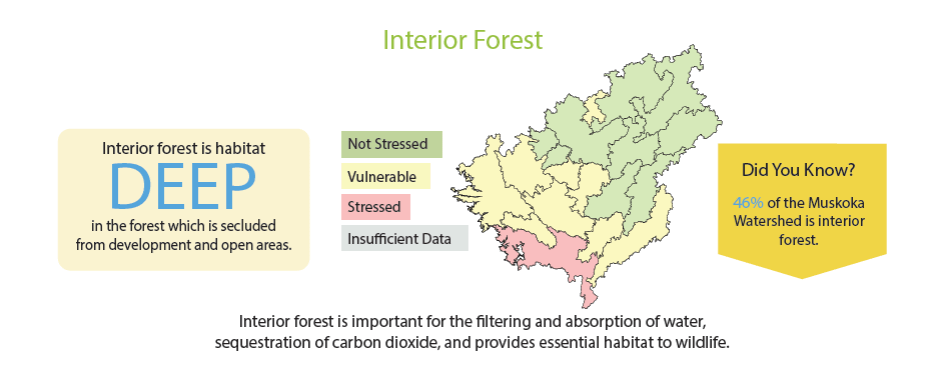
Interior forest habitat is located deep in the forest, secluded from the impacts of forest edge development and open habitats. The interior forest in Muskoka is primarily comprised of shade-tolerant and late-successional species such as sugar maple, American beech, basswood, ironwood, hemlock, and eastern white cedar. A group of mid-tolerant shade tree species such as eastern white pine, red pine, red oak, bur oak, swamp white oak, ash, yellow birch and black cherry are less common, but still important in interior forest in Muskoka.
Many of Muskoka’s wildlife species depend on interior forest habitat, however the development of roads, houses and other human-made structures fragment forested land, greatly reducing the amount of interior forest. Interior forest ecosystems can be threatened by permanent changes to the landscape such as development and permanent roads, however smaller impacts may also arise from less intensively used seasonal trails like snowmobile trails.
Although fragmented forests can still provide habitat for a vast array of wildlife, they lack patches of interior forest of sufficient size to sustain many interior species. Fragmentation can also interrupt the ecologically important connectivity across forested land.
Ecosystem functions provided by interior forests include the filtering and absorption of water into the ground; absorption of large amounts of carbon dioxide that would otherwise be released into the atmosphere; and photosynthesis. These ecological services and more are essential to wildlife well-being, as well as human health.
The 2018 Muskoka Watershed Report Card reports on the amount of Interior Forest in each quaternary watershed. Currently, the total interior forest cover across the Muskoka Watershed is 46%, but the amount of interior forest habitat in each quaternary watershed varies greatly across Muskoka, from approximately 17% in the Severn River Watershed to over 60% in the Rosseau River Watershed. More than 50% of a quaternary watershed should be comprised of interior forest in order for it to be considered not stressed.
How much interior forest is in your watershed? Check out the 2018 Muskoka Watershed Report Card at https://muskokawatershed.org to find out.
Species at Risk: Protecting Our Biodiversity
The 2018 Muskoka Watershed Report Card produced by the Muskoka Watershed Council features 8 different indicators of watershed health. Species at risk are one of these indicators, categorized as a threat indicator rather than a health indicator.
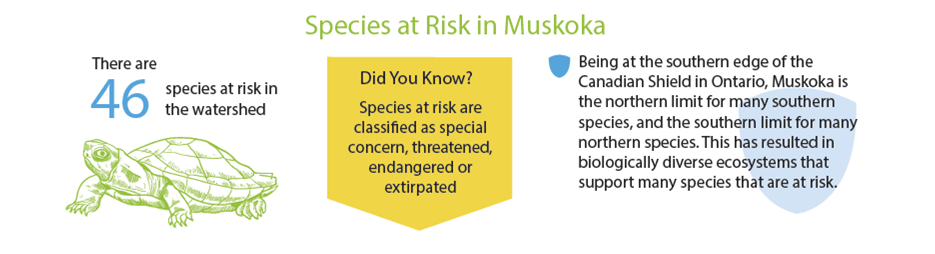
Species at risk are defined as plants and animals that are threatened with extinction, extirpation, or endangerment in a region due to natural and/or human-induced threats. These threats include: habitat loss, traffic mortality, disease, and invasive species. The increasing number of species at risk threatens local ecosystems and negatively impacts humans as we rely on healthy ecosystems to clean our air and water, as well as to support our resource-based economy.
There are 46 species at risk in the Muskoka Watershed. These species range in level of concern and are classified as either special concern, threatened, endangered or extirpated accordingly. As Muskoka is the northern limit for many southern species and the southern limit for many northern species, it is a biologically diverse haven. However, as human influences such as logging, road development and commercial development increase, these species are finding it more difficult to thrive here. Species at risk in the Muskoka Watershed include various birds, fish, insects, plants, snakes, lizards and turtles.
Becoming aware and involved is the best way to help species at risk. It is important to collect as much data as possible in order to understand how and where populations are declining. This can be done through citizen science initiatives in areas that rely on volunteers to help strengthen the existing data.
For more ideas on how to help species at risk and to see the different kinds of species at risk in Muskoka, view the 2018 Muskoka Watershed Report Card at https://www.muskokawatershed.org/.
Intruders in Muskoka: Invasive Species
The 2018 Muskoka Watershed Report Card produced by the Muskoka Watershed Council features 8 different indicators of watershed health. Invasive Species are one of these indicators, categorized as a threat indicator rather than a health indicator.
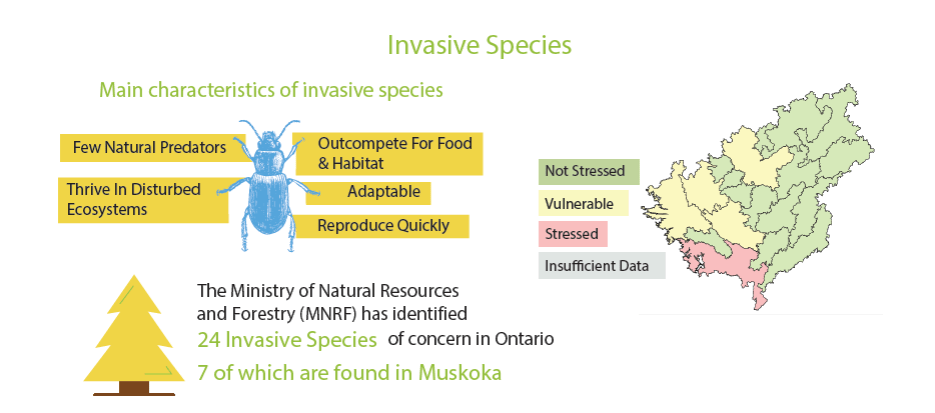
Invasive species are defined as plants, animals and micro-organisms that out-compete native species for habitat and resources when introduced outside of their natural past or present distribution. Their presence poses a threat to local ecosystems, but also to the economy as invasive species tend to cause a lot of irreparable damage to our goods and services.
The Ministry of Natural Resources and Forestry (MNRF) has identified 24 invasive species in Ontario, 7 of which are found in the Muskoka Watershed. These species are so successful because they have few natural predators, they thrive in disturbed ecosystems where other species do not, they are able to outcompete for food and habitat, they are adaptable, and they reproduce quickly. Due to these qualities, it is difficult to eradicate them. While there are some measures that can be taken once a species has established itself, the key is to prevent them from establishing in the first place.
Unfortunately, some of the popular activities in Muskoka such as boating, fishing, ATVing, and hiking heighten the risk of introducing invasive species to the Muskoka Watershed. Additionally, with increased tourist traffic into Muskoka this risk is heightened as well. The best defense against these intruders is knowledge. Knowing how to identify an invasive species, prevent transfer of invasive species and how to report them can help us to keep these unwanted visitors out of our communities!
Check out how your subwatershed ranks for invasive species and learn what you can do to help by visiting the 2018 Muskoka Watershed Report Card website at https://www.muskokawatershed.org/.
Fragmentation: A Big Concern For Muskoka
The 2018 Muskoka Watershed Report Card released by the Muskoka Watershed Council features 8 different indicators of watershed health. Fragmentation is one of these indicators, categorized as a threat indicator rather than a health indicator.
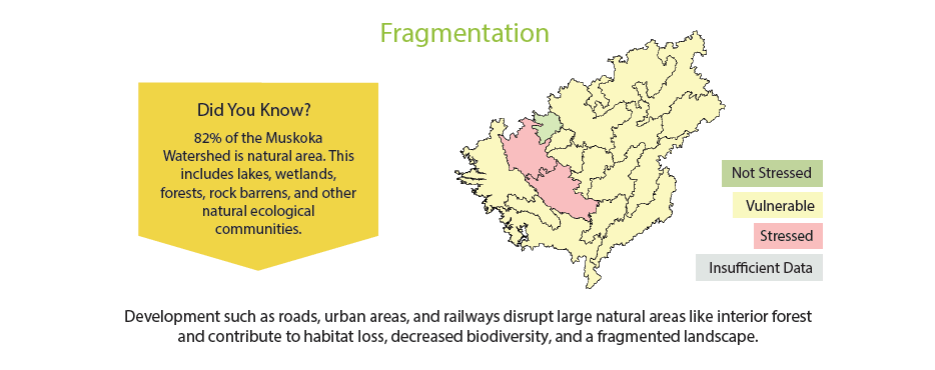
82% of the Muskoka Watershed is made up of natural areas which include lakes, wetlands, forests, rock barrens, and other natural ecological communities. Fragmentation is defined as the destruction of these natural areas for development purposes such as building roads, urbans areas, railways, etc. Fragmentation has multiple negative impacts such as habitat loss, decreased biodiversity, and a fragmented landscape which can greatly impact our economy. While development can allow for more people to come to Muskoka, too much development will result in a negative impact on Muskoka’s economy due to degradation of the landscape and a drop in tourism.
Large, undisturbed, natural areas are important for healthy watersheds and should be preserved in order to supply goods and services required satisfy the environmental, social, cultural and economic needs of our communities. The best way to limit the effects of fragmentation in Muskoka is to be a land steward and help support and protect shorelines and green infrastructure initiatives.
Check out how your subwatershed ranks for fragmentation and what you can do to help by visiting the 2018 Muskoka Watershed Report Card website at https://www.muskokawatershed.org/.
How Does a Changing Climate Impact Our Watershed?
The 2018 Muskoka Watershed Report Card produced by the Muskoka Watershed Council features 8 different indicators of watershed health. Climate Change is one of these indicators, categorized as a threat indicator rather than a health indicator.
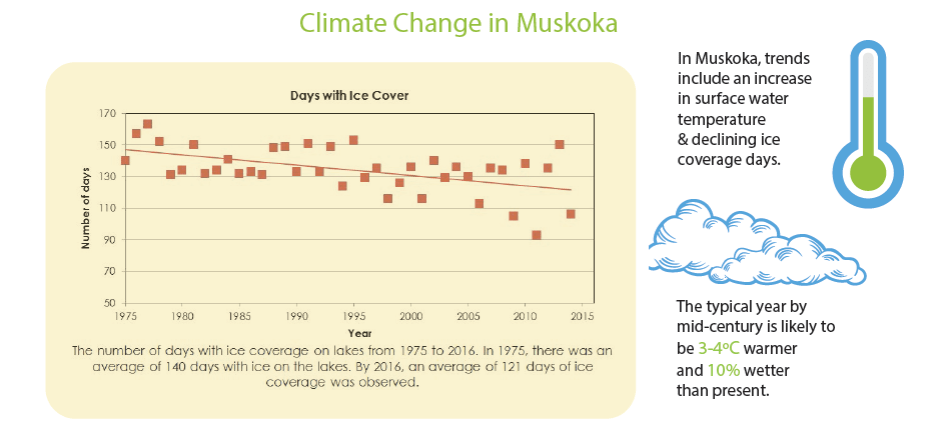
Impacts of climate change such as changing patterns of precipitation, increase in air and water temperatures, and water level changes have been observed in the Muskoka Watershed. Two key measurements being taken in the Muskoka region to indicate climate change are days of ice coverage and surface water temperature. Data that has been collected indicates an increase in surface water temperature and a decrease in days of ice coverage on our lakes due to warming temperatures.
Climate change threatens the Muskoka Watershed because it alters the frequency and severity of disturbances such as drought, flood, fire, windfall, insect outbreak and disease, while also pushing the forest into a climatic regime that will favour growth to a different degree of each tree species. Growth rates will be reduced, reproductive success will be lowered and susceptibility to disease and pests will be heightened in tree species. Climate change will also pose an issue for homeowners who rely on wells for domestic water supply.
To learn more about how climate change impacts the Muskoka Watershed and what you can do to reduce the effects of climate change, check out the 2018 Muskoka Watershed Report Card at https://www.muskokawatershed.org/.
Total Phosphorus? Totally Cool!
The 2018 Muskoka Watershed Report Card produced by the Muskoka Watershed Council features 8 different indicators of watershed health. Total Phosphorus is one of these indicators, categorized as a health indicator rather than a threat indicator.
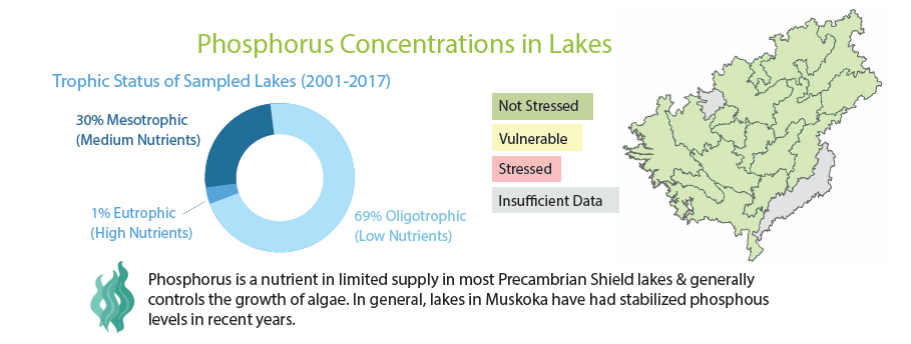
Phosphorus is a nutrient that is in limited supply in most lakes in Ontario. It greatly influences the amount of algae within a lake as it encourages the growth of algae. For this reason, a change in phosphorus concentration in a lake can impact the types of algae and the potential for an algal bloom to occur in that given lake. In any watershed, there is a natural variation in phosphorus concentrations from lake to lake due to lake size, flow characteristics, and sources of phosphorus.
Excessive phosphorus concentrations in a lake are usually the result of erosion and runoff from agricultural land that is treated using fertilizers or manure. The introduction of phosphorus into lakes is called nutrient enrichment or eutrophication which causes negative impacts at an ecological scale but also at an economic scale. Once algal blooms occur, people are much less likely to partake in lake activities such as swimming, boating, skiing, etc., causing our tourism industry to decline.
Muskokan’s have been taking great initiative to reduce their phosphorus loading over the recent years. Data records from the previous 30 years show an overall decline in phosphorus concentrations in the Muskoka Watershed. However, some phosphorus concentrations in certain lakes across the watershed are on the rise.
To see how your subwatershed ranks and to learn more about total phosphorus, check out the 2018 Muskoka Watershed Report Card at https://www.muskokawatershed.org/.
Calcium concentrations in our lakes: What do they mean?
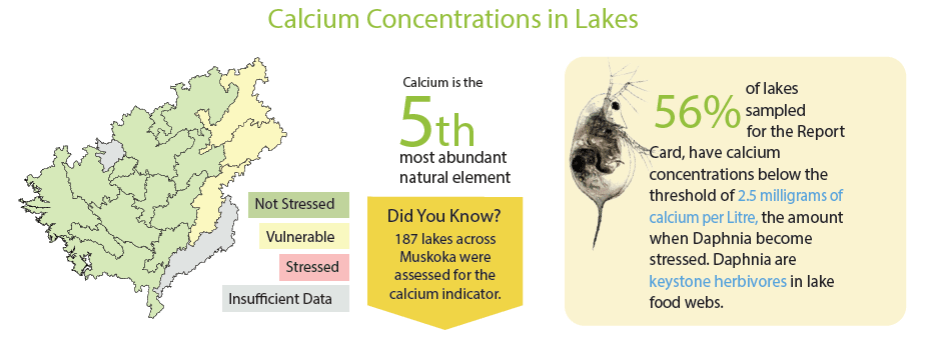
The 2018 Muskoka Watershed Report Card features eight different indicators of watershed health. Calcium concentration is one of these indicators, categorized as a health indicator rather than a threat indicator.
Calcium is an essential nutrient for all living organisms and plays an important role in buffering against acid rain. Between 1960 and 1970, acid rain intensified in the Muskoka region, causing calcium to leach from watershed soils into lakes at a faster rate than it could be replenished through weathering. This event, coupled with land clearing and logging, depleted the calcium bank. As a result, the pool of calcium within soils slowly depleted, as did the pool of calcium within our lakes.
Today, we are still seeing the effects of low calcium concentrations in the majority of Muskoka’s lakes, as well as the ecological effects which are both widespread and pronounced. Daphnia, a tiny zooplankton species, use the calcium in water to harden their carapaces. Daphnia are a keystone herbivore within lake food webs, making them an invaluable species. They provide food to many different fish species and eat algae, which keep the water in our lakes clear. Therefore, calcium concentrations are important to monitor because if they drop below the required levels for species such as Daphnia to thrive, these species become stressed, which will in turn have multiple negative impacts upon other species and watershed health in general.
In the 2018 Muskoka Watershed Report Card, each of the 19 subwatersheds within the Muskoka Watershed will receive a grade based upon the average calcium concentrations within their lakes. A total of 187 lakes are included in this assessment. Red indicates a stressed subwatershed, yellow indicates a vulnerable subwatershed, and green indicates a subwatershed that is not stressed.
Check out how your watershed ranks for calcium concentration, and what you can do to help by visiting https://www.muskokawatershed.org.